
SaaS Product Motion Design
New clinicians were dropping off during a 12-step activation flow. Activation rate sat at 41% and time-to-first-chart averaged 9 days.
Activation rate
87%
up from 41% in the first quarter
Time to first chart
90 min
down from a 9-day average
Support tickets
-63%
onboarding-related, month one
Clinician NPS
+34
first cohort post-launch
The Problem & Challenge
New clinicians were dropping off during a 12-step activation flow. Activation rate sat at 41% and time-to-first-chart averaged 9 days.
I spent my first week reading policy PDFs instead of seeing a single patient. By the time I reached the charting tool, I had already decided this was not the system for me.
Research & Discovery
Ran contextual inquiry with 14 clinicians across three hospitals. Mapped the activation journey and found six steps that could be collapsed into two. Prototyped three onboarding patterns and tested with Maze. Shipped a progressive disclosure flow that revealed complexity only when relevant.
Onboarding was compliance-first, not workflow-first
The 12 steps were ordered to satisfy legal review, not to mirror how a clinician actually starts. Compliance and workflow can coexist with resequencing.
The charting tool was buried three menus deep
Clinicians could not find the one action they came for. The activation flow never surfaced the core value — it only verified credentials.
Context was lost between sessions
When a clinician paused onboarding and returned the next day, progress reset visually. There was no resume cue, so they assumed they had to start over.
Journey map — where it broke
- 01Invite receivedEmail link expired after 48h; 14% never clicked.
- 02Identity verificationRequired a desktop browser; 31% were on mobile.
- 03Policy acknowledgementsSix separate PDFs, no progress indicator.
- 04Role selectionDropdown had 40 roles with no search.
- 05EHR connectionOpaque error if the hospital was not yet supported.
- 06First chartNo guidance; clinicians abandoned here most.
Design & Iteration Process
Each phase below presents the options we weighed, the tradeoffs, and the decision we made. Design is choosing between imperfect alternatives.
Move the first-chart experience to step 2, right after identity. Compliance acknowledgements shift to contextual moments inside the charting flow.
- Keep 12-step linear flowFamiliar to legal, but 59% drop-off persists.
- Progressive disclosure, 4 stepsChosenRequires legal sign-off on contextual compliance.
- Skip onboarding entirelyFastest, but clinicians miss critical policy context.
The Solution & Key Features
Reduced activation flow from 12 steps to 4. Introduced a guided first-chart assistant that cut time-to-first-chart from 9 days to under 90 minutes.
Progressive activation
12 sequential steps, compliance-ordered, no progress indicator.
4 contextual steps, value-first, with a live progress rail.
Spotlight · Clinicians reach the charting tool in under 5 minutes instead of 9 days.
First-chart assistant
No guidance; clinicians abandoned at the most critical step.
An inline side panel that teaches in context, then collapses when no longer needed.
Spotlight · First-chart completion rose from 44% to 91% in usability testing.
Resume banner
Returning clinicians saw a blank state and assumed they had to restart.
A persistent banner shows the exact step, with one-click resume.
Spotlight · False restarts dropped to near zero in the first month of launch.
Contextual compliance
Six PDF acknowledgements front-loaded before any real work.
Policy moments surface inline, at the point they become relevant.
Spotlight · Legal review passed with zero policy changes — only sequencing changed.
Outcome & Measurable Impact
It was the first onboarding that felt like it respected my time. I saw a patient on day one instead of reading policy for a week.
Lessons learned
- Compliance and workflow are not in conflict — only their sequencing was.
- The fastest path to activation is to surface core value, not to verify credentials.
- A resume cue is cheaper than a re-onboarding flow and far less frustrating.
Related case studies
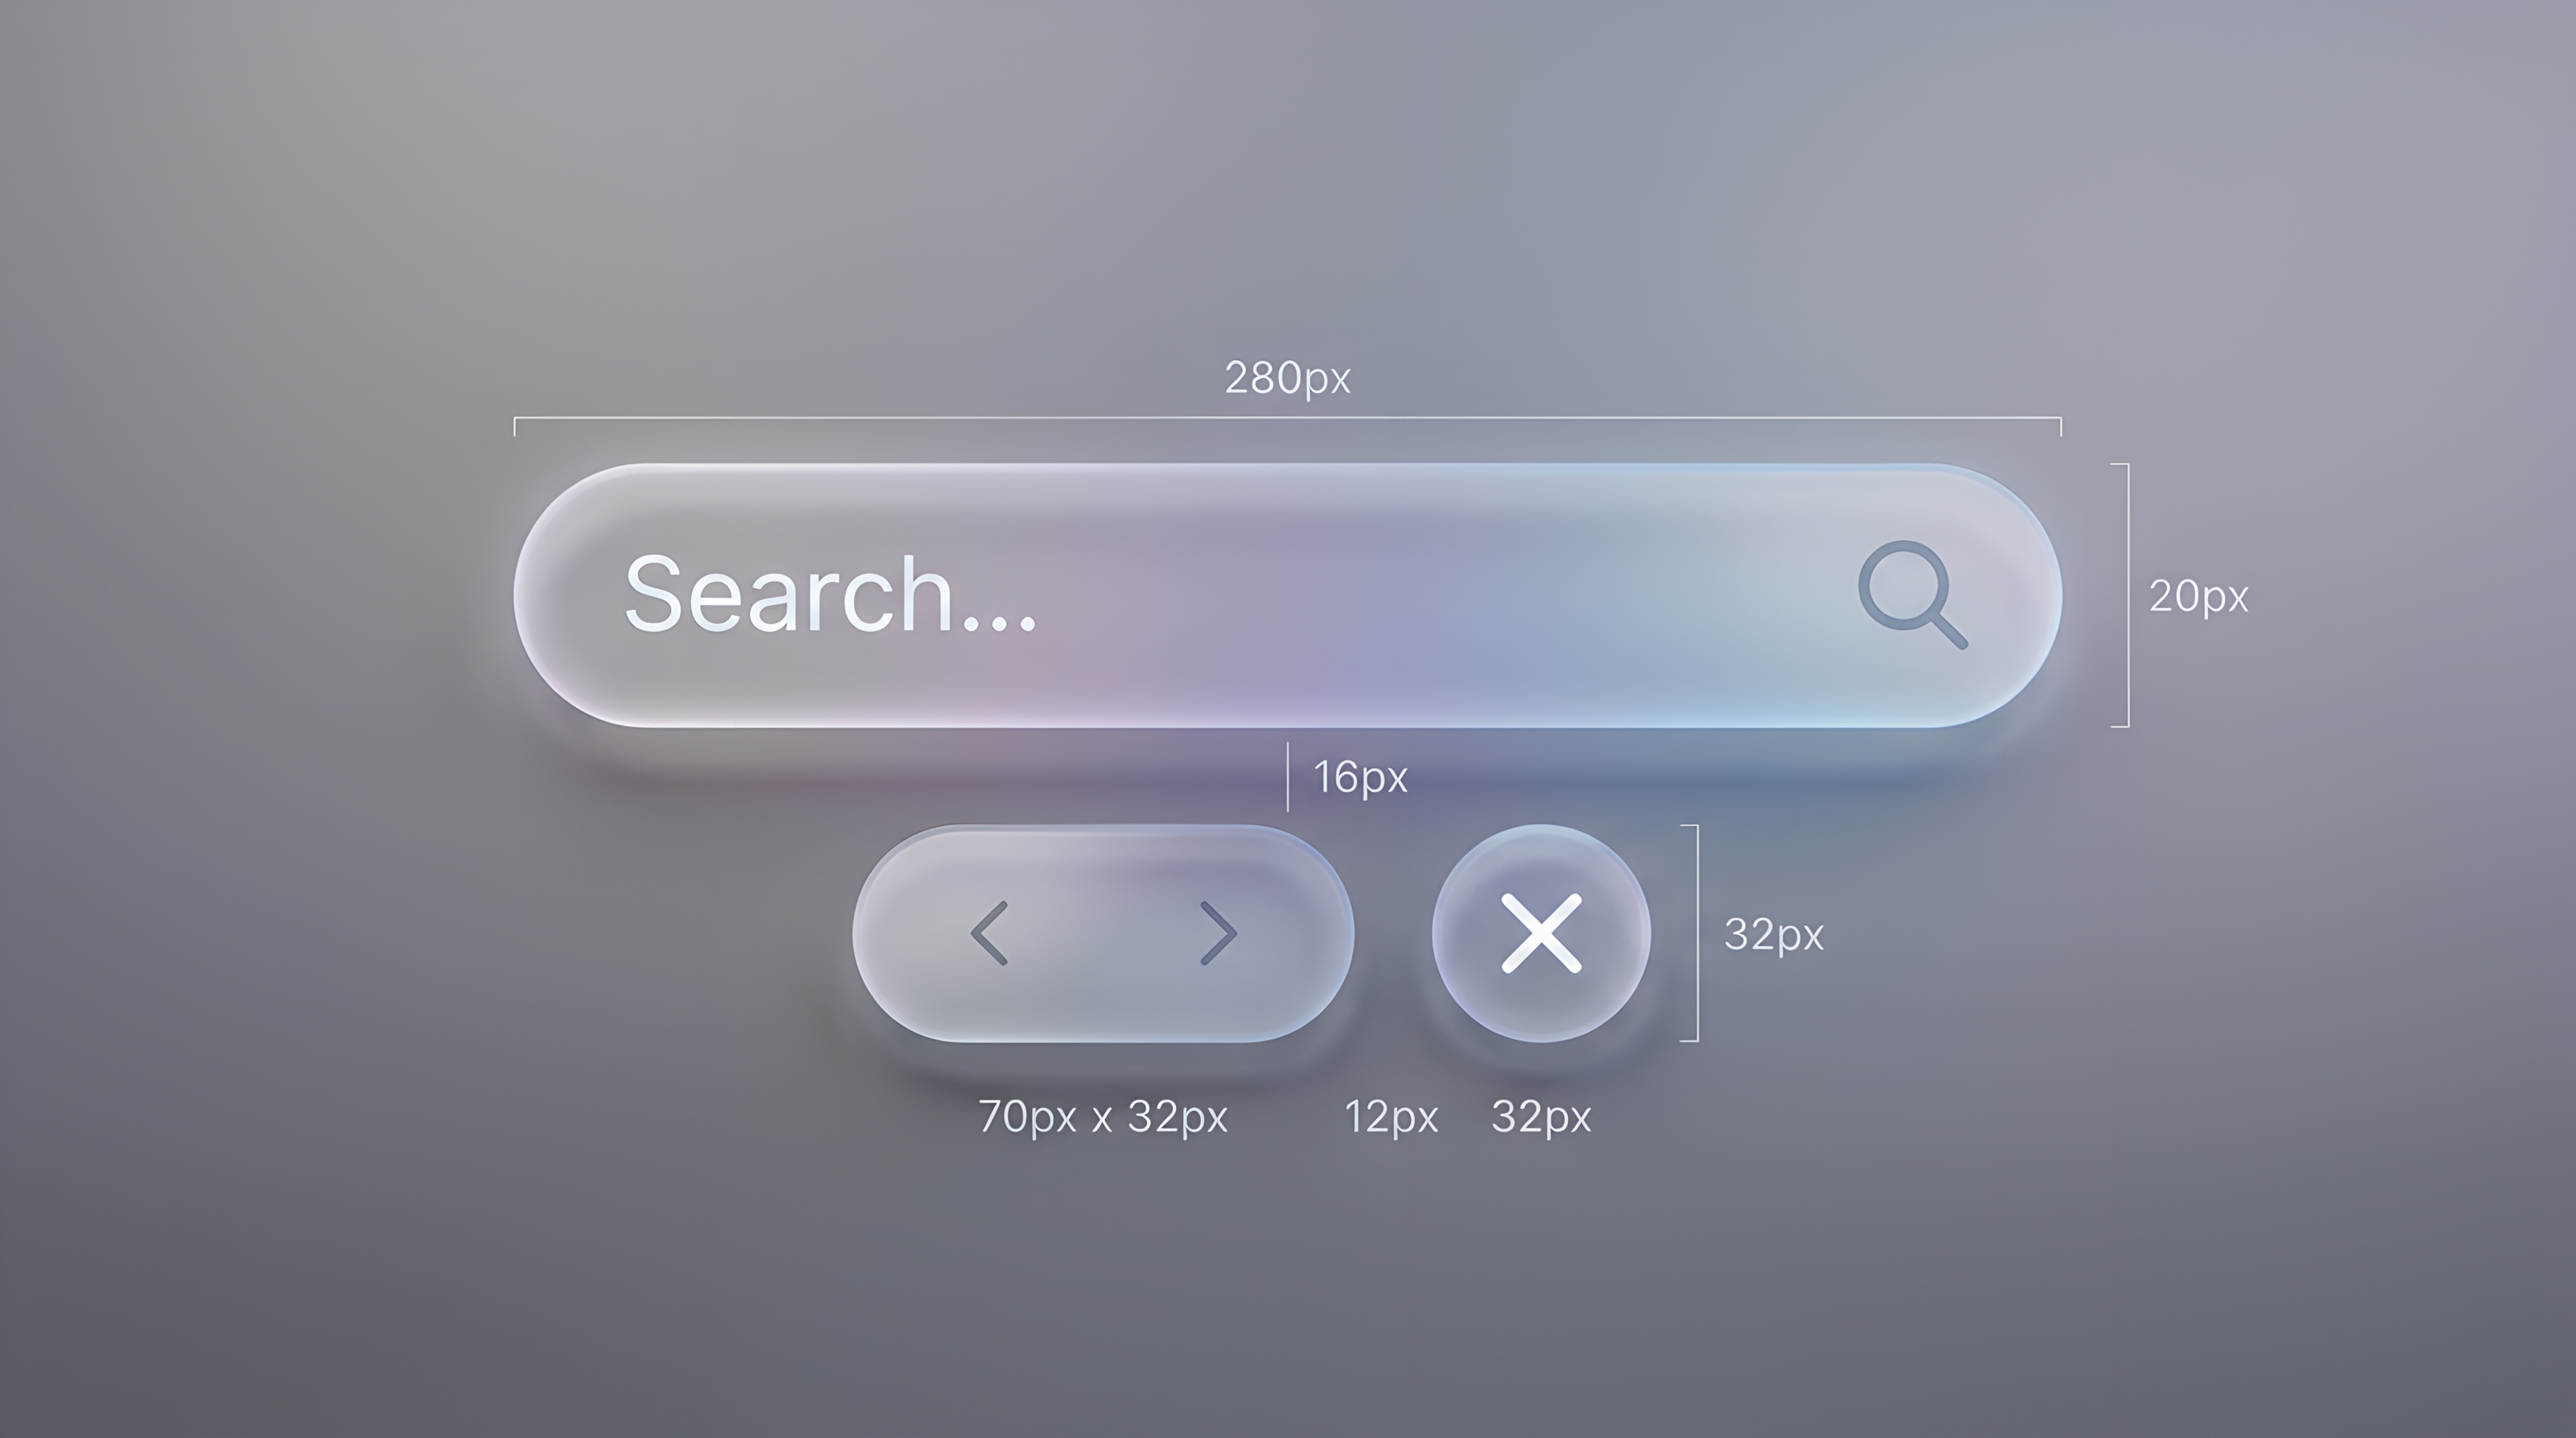
Clean glassmorphism effect element
2024Atlas · Senior Product Designer
Impact · Itinerary completion rate up 54%. Average session length grew 2.3x.
Read case study
Monolith Billing
2023Monolith · Product Designer
Impact · Involuntary churn fell from 7.2% to 2.1%. Recovered $1.4M in annual revenue.
Read case study